News
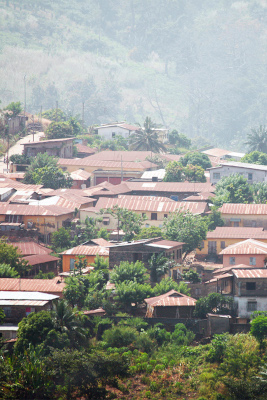
In order to decide where to implement safe water enterprise solutions, the feasibility of communities must be assessed. Currently, this is done using a ‘boots on the ground’ method, which is both time consuming and costly, even if data collection is performed digitally. Geographic Information Systems (GIS) can be used as a tool for assessing the distribution of key feasibility metrics, such as:
- Existing water infrastructure (competition)
- Surface water
- Population and demographics
- Road accessibility for drilling equipment
- Schools
- Clinics
- Markets
The purpose of this application is to ‘pre-screen’ communities within a region, so that your team can focus their field efforts only on the communities that show the greatest potential opportunity. The time and resources saved by pre-screening can be converted into additional safe water implementations.
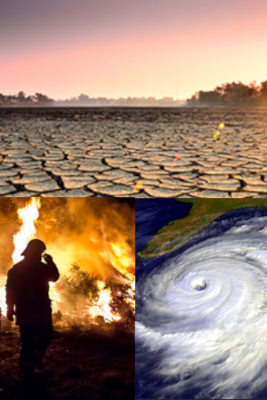
Risks present themselves in numerous formats, be they natural hazards, disease outbreaks, or socioeconomic collapse. All risks impact a safe water enterprise to some degree:
- Droughts - affects groundwater, which affects water supply. Agriculture and food resources are also affected, which has a socioeconomic impact.
- Floods - effect water quality, infrastructure integrity, and may lead to water-bourne disease
- Disease outbreaks - affect both the customer and the work force, which could lead to socioeconomic impacts. Greater water demand for sanitation and handwashing needs.
- Landslides and Earthquakes - can cause substantial damage to piped infrastructure, impact water quality, and require repair or rebuilding
The good news is that, with the right information, it's possible to plan mitigation for these unexpected scenarios, which is far better than determining solutions in the midst of chaos. The level of community resilience can be quantified in light of this information, and is provided within the application.
When designing safe water infrastructure, you need access to the best combination of tools - without the need for exporting and importing between them. We have integrated EPANET, an open source water system modeling tool from the EPA, into our GIS platform. The benefits of this are substantial:
- Integrated data accross your team's entire workflow
- Infrastructure data is accessible to the whole team, not just those who design it
- Piped systems can be designed over aerial imagery, and in the context of surrounding features
- Piped connections to structures can be visualized
- Run the EPANET model online and view and explore data within the app
- Gain real-time feedback on how your design influences community resilience
- Summary information regarding potential risks within the community

Lorem ipsum dolor sit amet, nam te vitae invidunt, quem laboramus pri ei, civibus definitionem ius no. Mel euismod splendide no. Ea meis eruditi his, id salutandi iracundia deterruisset qui. Ex nostro dicunt eloquentiam vis, mutat solet expetendis eam ea. Primis patrioque concludaturque te sed.
Soleat civibus disputando et vix, option eligendi interesset no sed, tale malorum duo ad. Cum an quis nihil consul, vim id laudem tempor. Et pri alii fastidii. Ei mazim detracto antiopam sed. Ex unum animal duo, eu eam errem quidam adversarium, at zril theophrastus contentiones eos. Debitis mnesarchum efficiendi his eu, sit tempor percipit signiferumque ut, sit harum interesset ei.
An wisi movet ceteros quo. Pro an movet nonumy signiferumque. Ea zril saperet mea, everti indoctum concludaturque an sed. Mei mnesarchum omittantur efficiantur at. Sit id alterum persecuti, nam cu noster nostrud.